
By Theodore de Macedo Soares
The 2020 Massachusetts Democratic Party presidential primary was held on March 3, 2020. Election results from the computerized vote counts differed significantly from the results projected by the exit poll conducted by Edison Research and published by CNN at poll’s closing. As in the 2016 Massachusetts primary between candidates Sanders and Clinton, disparities greatly exceed the exit poll’s margin of error. Sanders won Massachusetts in the exit poll and lost it in the computer count.
The discrepancies between the exit poll and the vote count for Sanders and Biden totaled 8.2%— double the 4.0% exit poll margin of error. Warren’s and Biden’s discrepancies totaled 8.0%, also double the margin of error. These discrepancies replicate the total discrepancy of 8.0% favoring Clinton in the 2016 Massachusetts Democratic Party primary between her and Sanders. This time two progressive candidates exhibit the same discrepancies now favoring Biden representing the establishment’s choice.
Presidential candidates Biden’s and Bloomberg’s vote counts exhibited the largest disparity from their exit poll projections. Biden’s unobservable computer-generated vote totals represented a 15.7% increase of his projected exit poll share. Given the 1,342,905 voters in this election, he gained approximately 60,900 more votes than projected by the exit poll. Bloomberg increased his vote share by 28.2% and approximately 34,500 more votes than projected. Their gain came largely at the expense of candidates Sanders and Warren whose combined vote counts were 97,000 less than projected by the exit poll.[i]
Noteworthy is the fact that the 2016 Massachusetts Republican Party exit poll taken at the same time and at the same precincts as the Democratic Party primary, and also with a crowded field of five candidates, was matched almost perfectly by the computer count—varying by less than one percent for each candidate.
Exit polls are widely recognized—such as by, for example, the United States Agency for International Development (USAID)—as a means for checking the validity of vote counts. The U.S. has financed exit polls in other countries to “ensure free and fair” elections.
The United States remains one of the few major democracies in the world that continue to allow computerized vote counting—not observable by the public—to determine the results of its elections.[ii] Countries such as Germany, Norway, Netherlands, France,[iii] Canada,[iv] United Kingdom, Ireland, Spain, Portugal, Italy, Denmark, Sweden, Finland and many other countries protect the integrity of their elections with publicly observable hand-counting of paper ballots.[v]
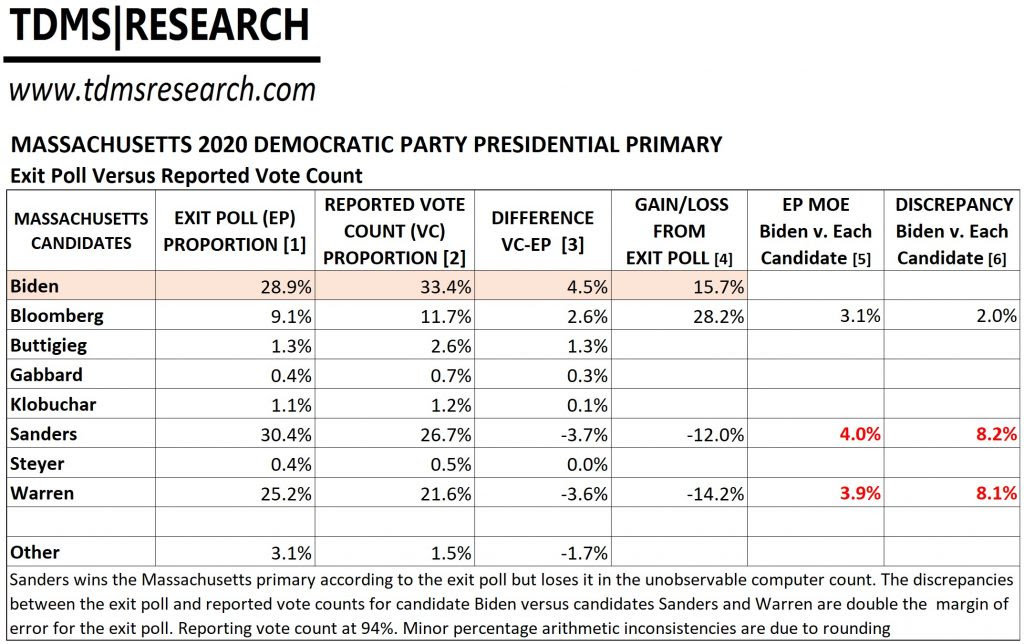
[1] Exit poll (EP) downloaded from CNN’s website by TDMS on election night, March 3, 2020 at 8:00 PM. Candidates’ exit poll percentage/proportion derived from the gender category. Number of EP respondents: 1,394. As this first published exit poll was subsequently adjusted towards conformity with the final computerized vote count, the currently published exit poll differs from the results above.
[2] Candidates’ percentage/proportion of the total computer-generated vote counts derived from reported counts (94% reporting) updated on March 4, 2020 and published by The New York Times. Total number of voters: 1,327,374
[3] The difference between the exit poll proportion and reported vote proportion for each candidate (subtracting values in column two from the values in column three). A positive value indicates the candidate did better and received a greater share of the total reported count than projected by the exit poll. For example, candidate Biden, reported percentage/proportion of the total vote increased by 4.5% compared to his exit poll share.
[4] This column shows the percentage increase or decrease from the candidate’s exit poll projection (difference in column four divided by exit poll proportion in column two). Shown only for candidates with 4% or more share in the exit poll.
[5] This column presents a distinct Margin of Error (MOE) of the exit poll (EP) for the differences between candidate Biden and each of the other candidate’s EP results. The exit poll MOE, for example, between Biden and Sanders is 4.0% and the MOE between Biden and Warren is 3.9%. For simplicity MOE not shown for candidates with less than 4% share in the EP. MOE calculated according to multinomial formula in: Franklin, C. The ‘Margin of Error’ for Differences in Polls. University of Wisconsin, Madison, Wisconsin. October 2002, revised February 2007. Available at: https://abcnews.go.com/images/PollingUnit/MOEFranklin.pdf
[6] The disparities between the exit poll and the reported computer-generated vote counts comparing Biden and each of the other candidates (subtracting each candidate’s difference between exit poll and computer count from Biden’s difference of 4.5%.). Disparities for candidates Sanders and Warren are double their respective MOE. For example, candidate Biden’s unverified computerized vote count exceeded his EP projected vote proportion by 4.5% while Sander’s computerized count understated his EP projected vote proportion by 3.7% for at total discrepancy of 8.2%. This 8.2% disparity, greatly exceeding the statistical 4.0% margin of error based on their exit poll proportions, is significant as it cannot be attributed to the MOE.
[i] Sanders received 49,045 less votes than projected by the exit poll and Warren 48,000 less.
[ii] Fittingly, according to a recent Gallup World Poll, only 40% of Americans say they are confident in the honesty of U.S. elections. Finland and Norway with 89% of their citizens expressing confidence in the honesty of their elections along with the citizens of 25 other countries have greater confidence in their elections than do Americans.
[iii] During the 2007 presidential election, eighty-three municipalities (France has 36,569 municipalities) were allowed to use voting machines. Due to security concerns and the inability of voters to determine if their votes are counted correctly a moratorium, that remains today, prevents additional municipalities from introducing voting machines. In the 2012 elections only 64 municipalities continued their use. The French government desires a total ban on their use.
[iv] In Canada, the results of federal elections are determined exclusively by hand-counted paper ballots. Some provinces have adopted voting machines for local elections. See here, here and here.
[v] The United States’ long ballots–containing federal, state, and local races–are commonly cited as being unwieldy for hand-counting. The use of Sweden’s method of providing different colored paper ballots for federal, state, and local races that are then sorted prior to hand-counting addresses this objection and allows for at least the hand-counting of federal elections with only three races per ballot.
Please share this article: This entry was posted in Election Integrity and tagged 2020 Massachusetts Democratic Party primary, Biden, Election Fraud, Election Integrity, Exit Polls, Hand-counted ballots, Sanders, Warren by Theodore de Macedo Soares. Bookmark the permalink. Oringal here http://tdmsresearch.com/2020/03/04/massachusetts-2020-democratic-party-primary/--